Worksheet from mathswatch - Scatter Graphs clip 87
30 November - due 7 December
Histograms Worksheet
All homework received. Thank you.
23 November - due 30 November
No homework yet received from the following students:
Ellie, Fiona, Annu
Produce an infographic
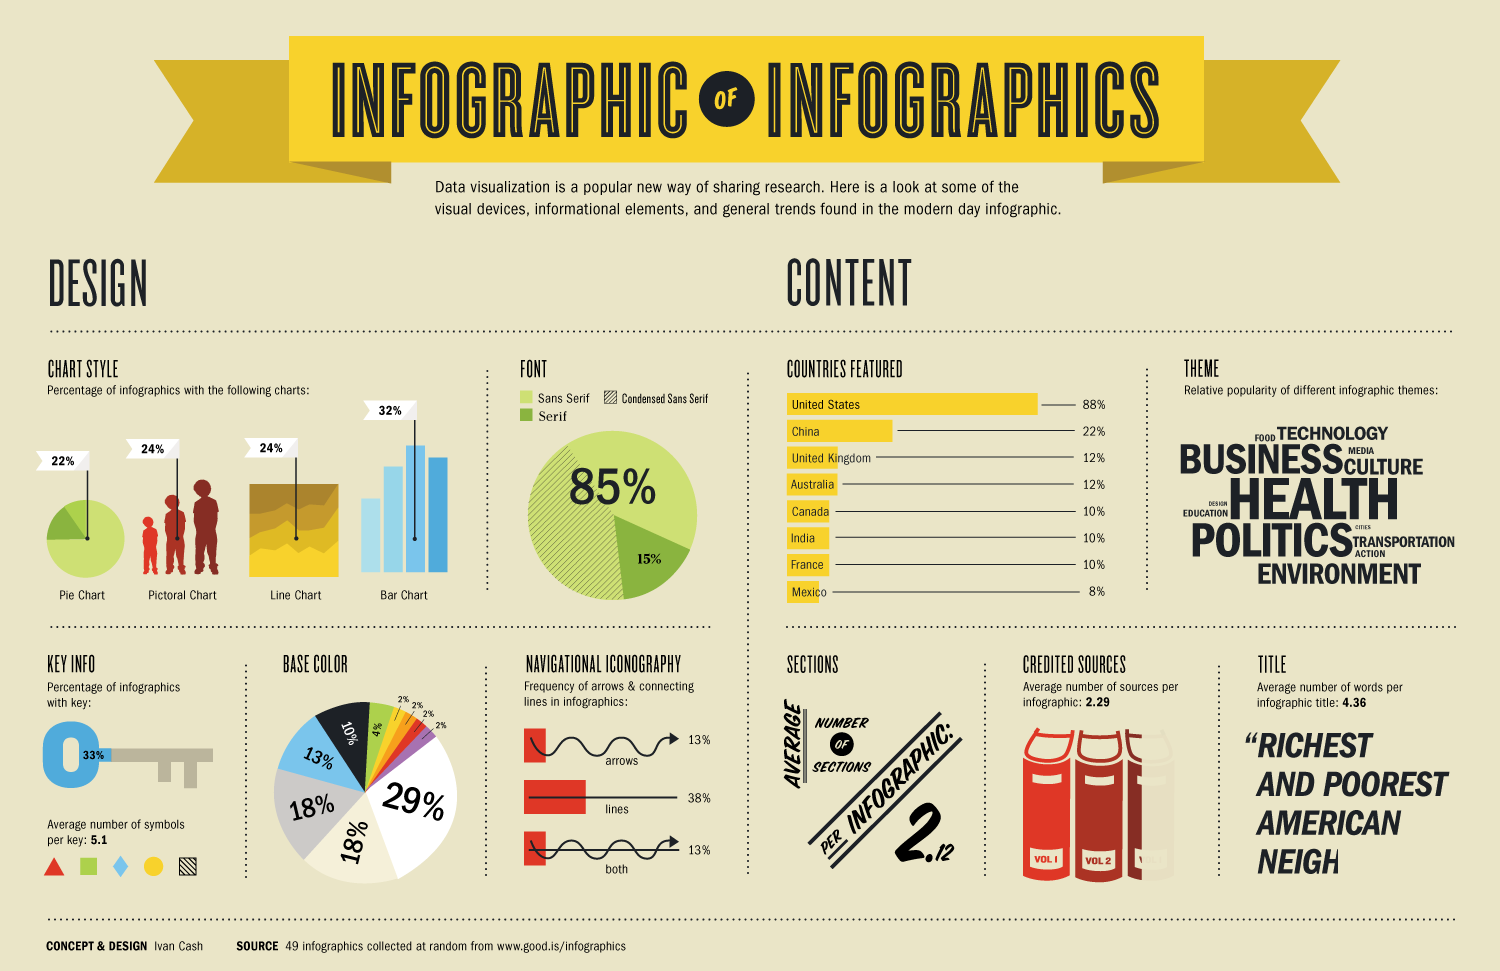
Produce:
- a dual or composite bar chart
- a pie chart (comparative pie chart if you are adventurous!)
- one other form of visual data representation (pictograms, bubble charts, stem and leaf, something else new)
- a title
- an appropriate image
- a small piece of written text about the topic
No comments:
Post a Comment
Please add any comments that could be used to help improve the learning of the group.